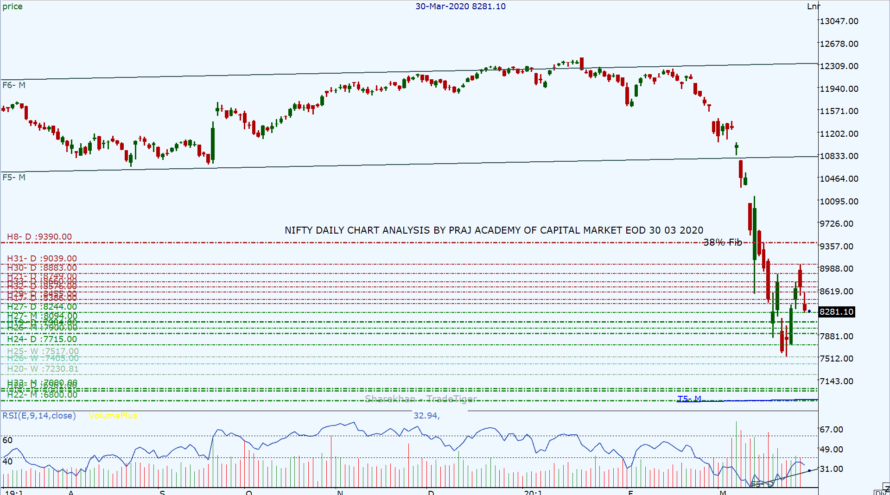
The benchmark #Nifty opened a gap down 274.30 points at 8,385.95 where we observe some recovery with that the Nifty hit’s day’s high at 8,576. Soon after due to negative global cues of fast-spreading COVID-19 in the United States & Europe, and IMF Chief’s warning of global recession extended selling pressure in the Nifty which fell sharply 379.15 points and close at 8,281.10 with forming Bearish Candle on Daily Chart. On the weekly chart as well as on the monthly chart, it made a bearish candle. The market needs positive cues from domestic or international markets (which are missing at present) to start moving upwards. If the Nifty could sustain above 9,000 level on a closing basis in upcoming trading session then we might see a pullback toward 9,400 and if Nifty falls below 7,900 it will continue its downward journey towards 7,500.
The FIIs were net sellers with a turnover of 4363.61 Cr whereas DIIs were net buyers with 3550.33 Cr. The market breadth was negative with 12 stocks advance and 38 stocks decline from the stack of nifty 50. The closing of #Nifty at 8,281.10 is well below 200DEMA at 11,293 and the daily pivot at 8,740.68. The daily Stochastic has decreased to 69 and RSI is at 33 indicating the market is still near to #overbought zone but with low strength. We may see some consolidation at this level before the next move.
Nifty’s new #resistancelevels are at 8,386, 8,455, 8,576, and 8,660 while the support levels are at 8,244, 8,094, 7,984, and 7,900. The fear gauge (India VIX) has increased to 71.89 with increased ATR of Nifty and Bank Nifty due to fear of uncertainty of the markets which is driving the indices volatile. The daily trading range for the next session as per the Nifty chart seems to be very wide now from 7,900 to 8,660.
#BankNifty also followed the broader Index and closed at 18,782.40 with a loss of 1,186.60 points making a bearish candle on the daily chart. New resistance levels are at 19,057, 19,254, 19,420, and 19,716 while key support levels are at 18,669, 18,365, 18,158, and 17,756. The trading range for BN looks between 17,756 to 19,716 from the daily chart. The #PCR ratio for the current series (1st April 20) is 0.58 indicating the market is still in the grip of bears.
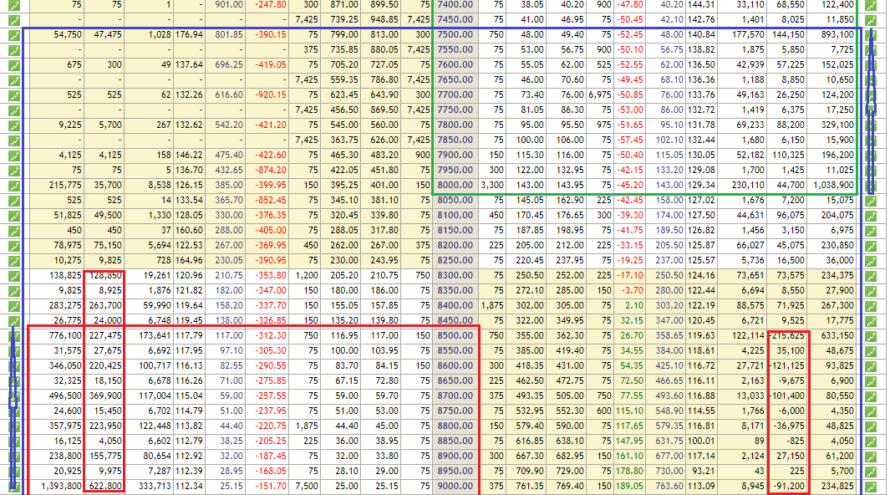
As per Nifty #OptionChain data (1st April), Put writing was observed from 7,000 to 8,400 whereas Call writing was observed from 8,000 to 10,000 levels. Unwinding was observed at higher levels of Put from 8,500 to 9,000 where very less unwinding of Call observed at higher levels 10,200 onwards. Max OI in PE is at approx 7,000 and CE is at 10,000. The #PCR for the current series is 0.63 which indicates a bearishness in the market. OI data shows the possibility of the next trading range between 7,500 to 9,000 with volatile swings. Traders are advised to be careful from volatility and trade only trends with options strategies with close stops.
#Technicalanalysis with a sound understanding of the market is the key to trading success; however, unexpected (domestic or international) factors make the technical analysis go haywire for a while, hence we have to monitor fresh data and new dynamics of the market during trading hours to consistently make money. We trust the information will be helpful in your own analysis of the market and make trading a profitable and better experience. This analysis has been shared for educational purposes. Please seek your financial adviser’s guidance before trading or investing.
Happy Trading and Keep investing safely!